meta data for this page
Tree Map Example
“Treemaps display hierarchical (tree-structured) data as a set of nested rectangles. Each branch of the tree is given a rectangle, which is then tiled with smaller rectangles representing sub-branches. A leaf node's rectangle has an area proportional to a specified dimension on the data. Often the leaf nodes are colored to show a separate dimension of the data.” - Wikipedia
This example shows a breakdown of Design Optimization Competition 2012 participants.
Example chart
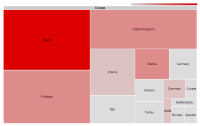
Participants of Design Optimization Competition 2012
(If the chart below does not show, please reload this page)
- Size shows number of participants from each continent/country
- Colour shows number of submissions from each continent/country
- Right-click to go back to the continent level
Discussion